Unittests' code coverage in PyCharm
PyCharm's my favorite IDE in years. Granted, learning how to use it can be like the first few minutes of Flight of the Navigator, but whenever I begin a new kind of task, PyCharm surprises me with the depth of its feature set.
Today was my first day at 10gen. One of my first tasks is to assess the Mongo Python driver's unittesting coverage. (Summary: coverage is pretty good, but not great.) Nosetests and coverage.py can give me an overview, but how awesome would it be if I could see which lines of code are exercised by the unittests in my IDE?
PyCharm, as of the October 4 Early Access Preview, can run unittests with code coverage analysis within the IDE. Here's how.
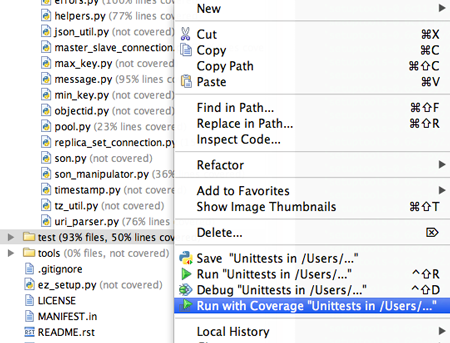
pymongo's unittests are all in the tests/ directory, as they ought to be, so in PyCharm you can simply open the Project pane and right-click the tests/ directory and choose "Run with Coverage":

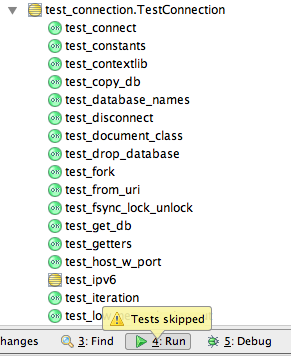
PyCharm will show you your tests' outcomes in a nice tree diagram:

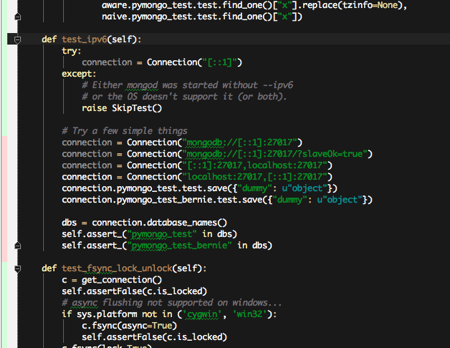
It also displays which lines were exercised by your unittests, and which were not, in two places. First, in your source files themselves, by adding a green (exercised) or red (omitted) bar to the left of the source lines:

You can see here that I started my local Mongo server without IPv6 support, so the IPv6 unittest was skipped.
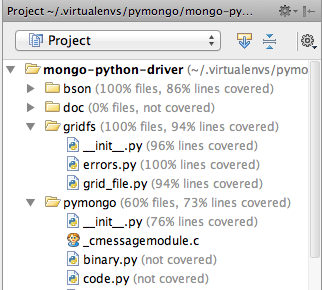
You can also see test coverage in your Project pane, neatly rolling up coverage statistics by file and by directory:

If you close the project and re-open it, you'll lose your code-coverage display, but you can redisplay it with Tools->Show Code Coverage Data. PyCharm will show you coverage data from recent runs and let you re-display it.
As always with PyCharm, it takes a little fiddling and Googling to get all this to work, but the result is simply brilliant. I hope this post helps you find your way through a valuable feature.